When I look at the graph of dividends for each month if I click on a particular month I see below the list of dividends. But it looks like that the number of row is fixed and limited and therefore only can see part of the total number of rows.
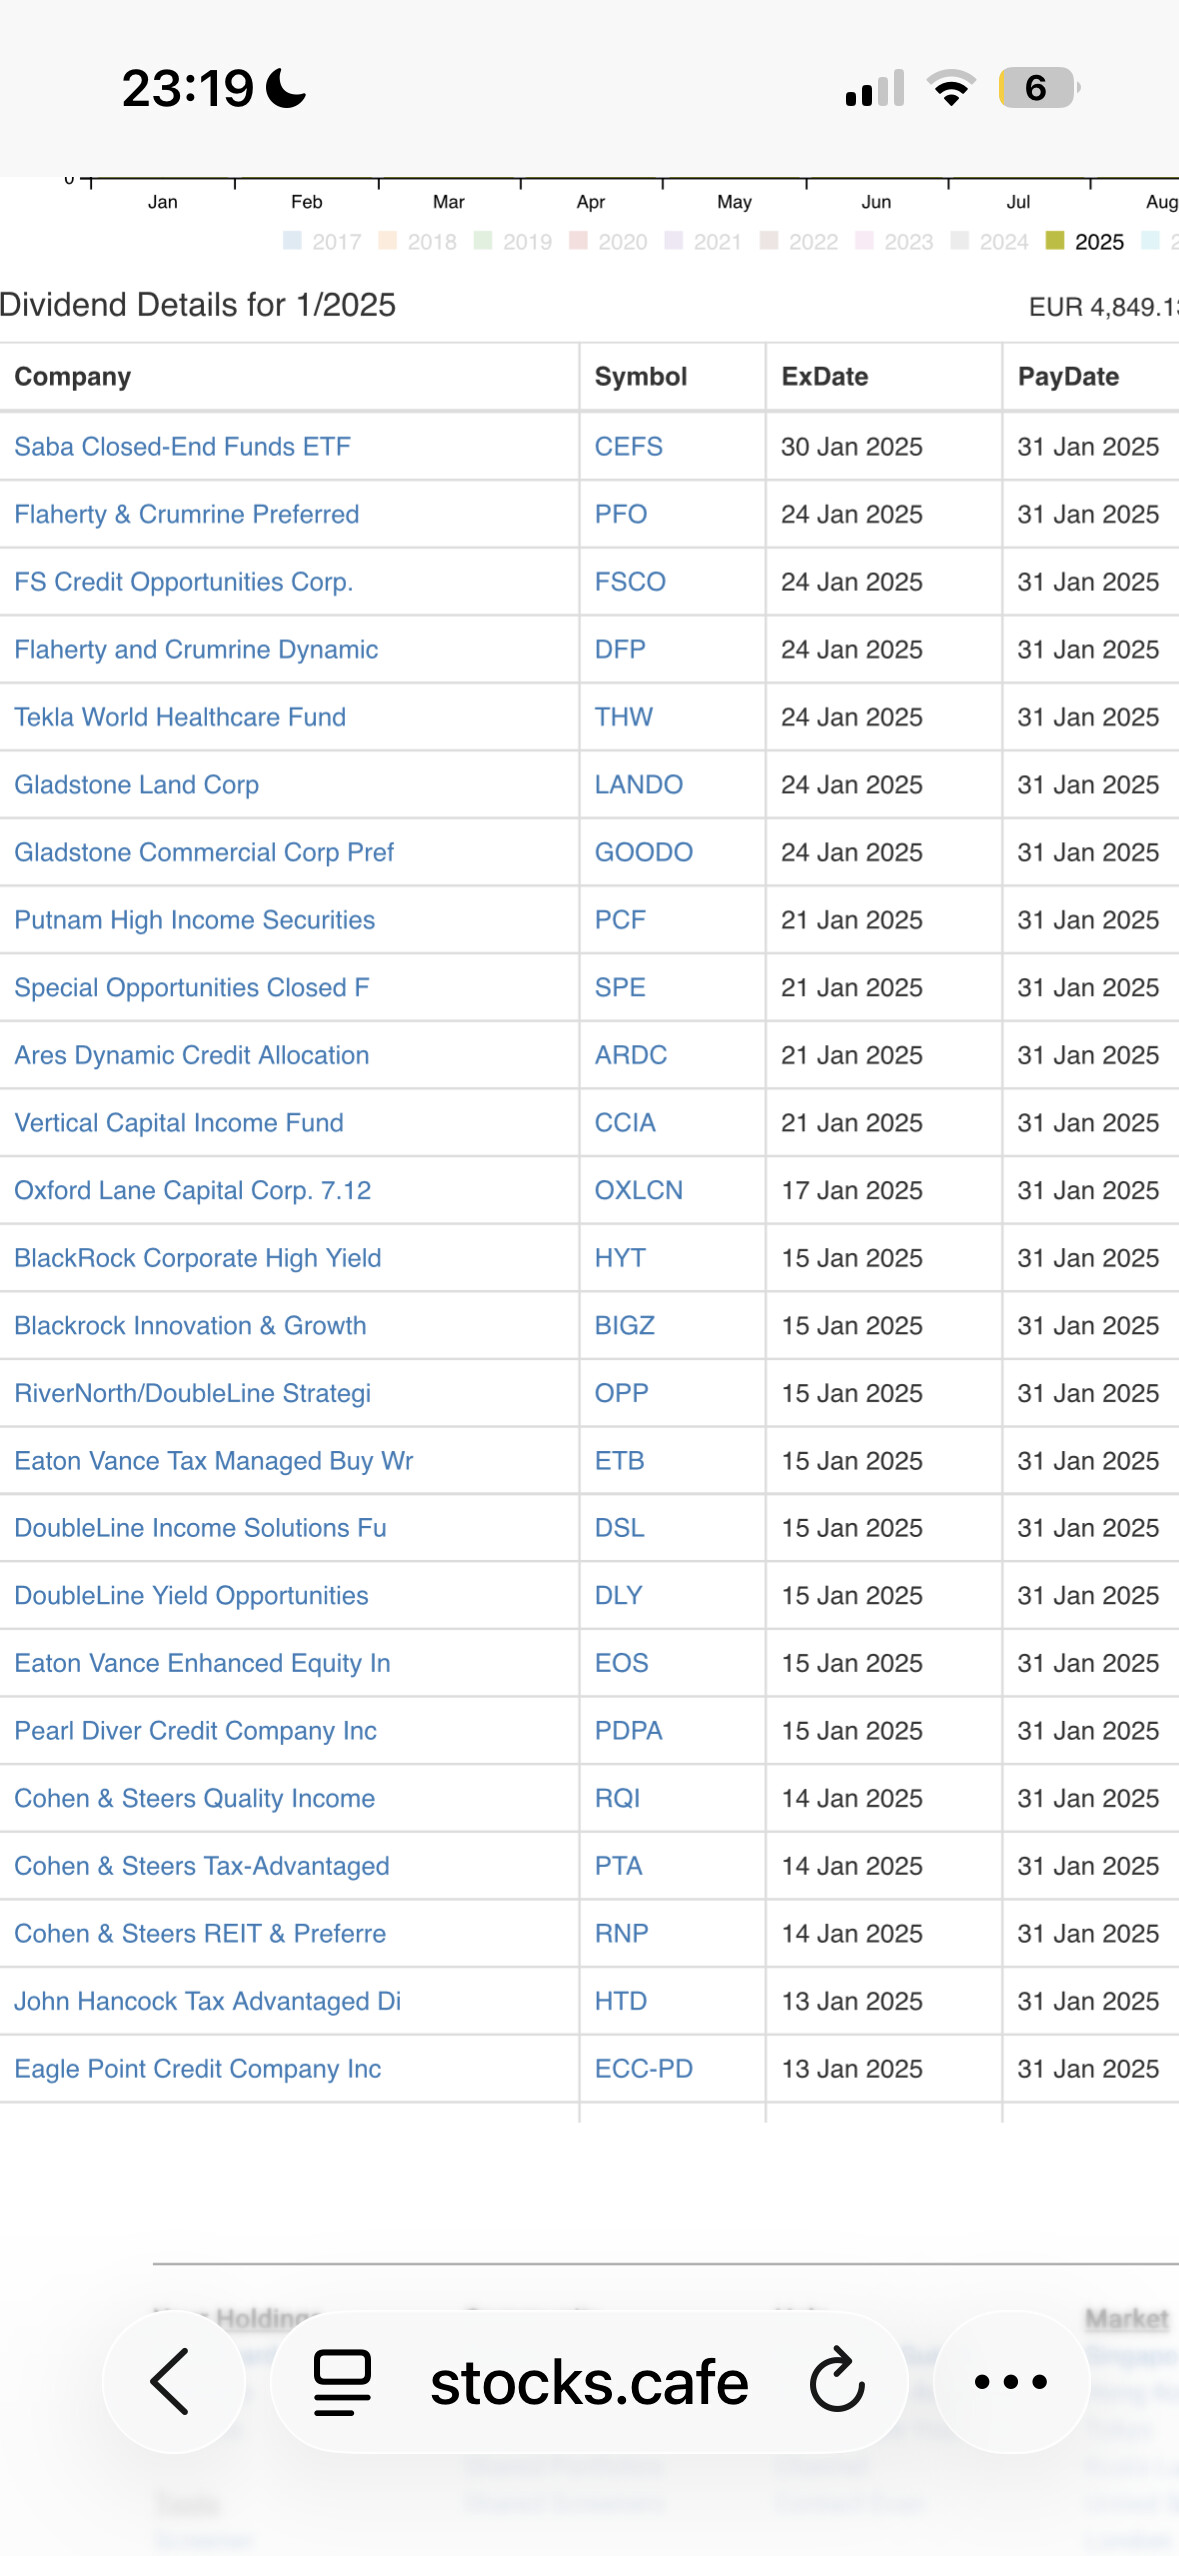
See in attached I selected 01/2025 and view by paydate and only see limited number of rows that are truncated so that actually can only see dividends for 31 January 2025 while I should see dividends all the way to 1 January 2025.
If I select another month then number of row is actually unchanged and lots of data is missing,
Can please make sure that the detailed list is complete. Try he!!
I believe you are looking at this page right? → https://stocks.cafe/portfolio/report?portfolio_graph=2
You actually can scroll on that list to see everything. Try putting your mouse within the list and scroll.
This is strange. I just tried on desktop, it would change. Please make sure that you are click on the bar itself where you would also see the mouse change from black pointer to white hand. The graph needs to be in focus for that to happen (this means you might need to click two times. First time to focus on the graph then second time to select it)