hi @evankoh,
possible to have options tab displaying weekly,monthly/year chart return? can we have this?
hi @evankoh,
possible to have options tab displaying weekly,monthly/year chart return? can we have this?
Can you share more? Is there a current existing tab or page from portfolio that you want to mirror for options?
@evankoh
you might want to mirror from page under portfolio dividend?
https://stocks.cafe/portfolio/collected
and please have a option to filter by week/month/year?
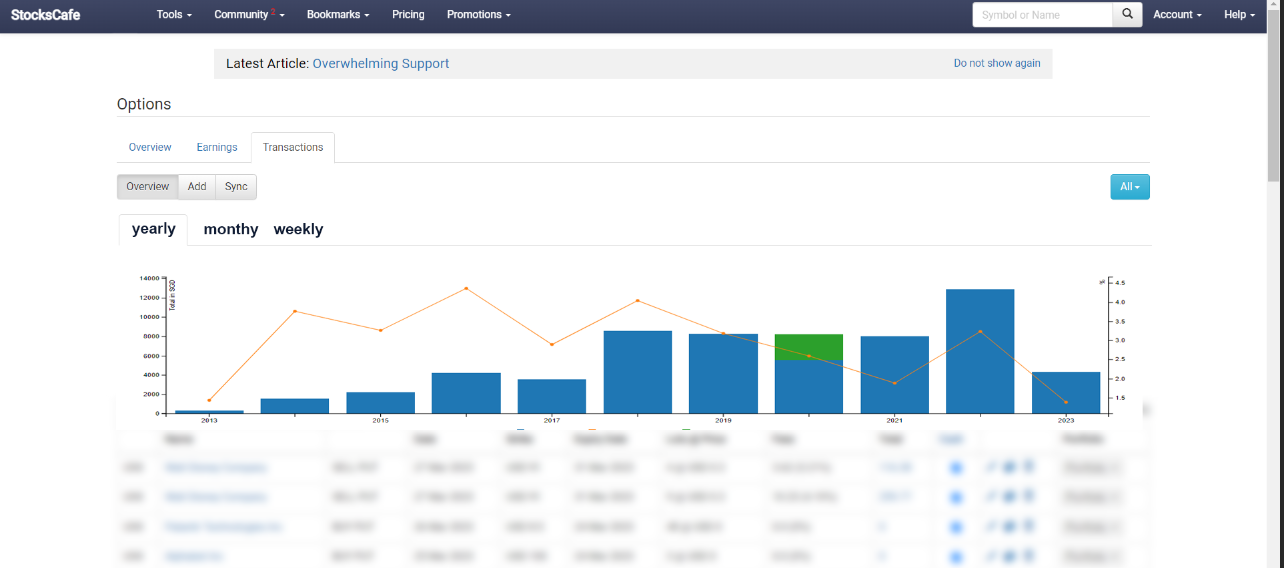
below is a sample idea add graph onto the options transactions page
Hmm…
Actually, would it be better to be on closed position tab? → https://stocks.cafe/options/closed_positions
Then add a subtab summary to sum up the P&L by week/month/year?
yes if possible, please include the graph.
Sure. I will look into this. I have been thinking about something along this line for some time for Closed Positions of Portfolio as well.
Hi Evan, i wonder if you are also looking to expand the P&L results of Options by year/ select time periods, similar to what we have in Portfolio?
Understand the difficulty to combine Options into Portfolio, hence the combination is done the other direction instead. Thought it’ll be good to also include the split by years etc.
Hi there,
I am not really thinking about doing that but it make sense to have more granular breakdown of it by time period.
Would you like to suggest something more specific?
Thanks,
Evan
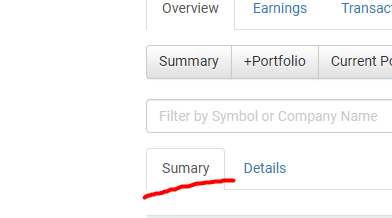
At the option’s “+Portfolio” page, perhaps we can include the % change in brackets, identical to the Portfolio Overview page.
Then for the charts/tables, perhaps we can take a leaf out of Portfolio’s “report” tab, TWR by year (table), Profit & Loss by year (table), Overall P&L chart by month. Not sure if it makes sense to calculate XIRR for options, but if it makes mathematical sense then that in table form too. ![]()
I need to think about this. It is not easy to compute base cost for options. Example: When you short call or short put, what is the cost?
Hmm… Maybe I can do a mini Report tab for options where it will tabulate the monthly/quarterly/yearly P&L and other informations.
I think the challenge would be attribution of P&L across period. e.g. if I short put an option for USD 30 in premium and it spans across 2023 and 2024. How to split the P&L across? I guess the “most accurate” is based on how the option prices have changed but honestly my option data is of relatively low quality to be used for that.
The most simple will be to attribute at close or expiry.
Need to think harder about this.
Added some summary to Closed Positions → StocksCafe
typo here